|
|
|
Lösungsmittel |
ET(30) (kcal/mol) |
l max(10) (nm) |
ET(10) (kcal/mol) |
|
Wasser |
63.1 |
n. meßbar |
- |
|
2,2,2-Trifluorethanol |
59.8 |
Zersetzung |
- |
|
Formamid |
55.8 |
516* |
55.4 |
|
Methanol |
55.4 |
500 |
57.2 |
|
N-Methylformamid |
54.1 |
525* |
54.5 |
|
Ethanol |
51.9 |
522 |
54.8 |
|
1-Propanol |
50.3 |
534 |
53.5 |
|
1-Butanol |
49.7 |
538 |
53.1 |
|
1-Pentanol |
49.1 |
538 |
53.1 |
|
1-Hexanol |
48.8 |
538 |
53.1 |
|
1-Heptanol |
48.4 |
540 |
52.9 |
|
2-Propanol |
48.4 |
547 |
52.3 |
|
1-Octanol |
48.2 |
544 |
52.6 |
|
1-Decanol |
47.7 |
545 |
52.5 |
|
Acetonitril |
45.6 |
609 |
46.9 |
|
Dimethylsulfoxid |
45.1 |
615 |
46.5 |
|
N,N-Dimethylformamid |
43.3 |
636 |
45.0 |
|
Aceton |
41.8 |
655 |
43.7 |
|
1,2-Dichlorethan |
41.3 |
685 |
41.7 |
|
Dichlormethan |
40.7 |
693 |
41.3 |
|
Pyridin |
40.5 |
683 |
41.9 |
|
Chloroform |
39.1 |
715 |
40.0 |
|
Essigsäureethylester |
37.9 |
724 |
39.5 |
|
Tetrahydrofuran |
37.4 |
734 |
39.0 |
|
1,4-Dioxan |
36.0 |
Zersetzung |
- |
|
t-Butyl-methyl-ether |
34.7 |
n. löslich |
- |
|
Benzen |
34.3 |
816 |
35.0 |
|
Tetrachlormethan |
32.4 |
n. löslich |
- |
|
Cyclohexan |
30.9 |
n. löslich |
- |
|
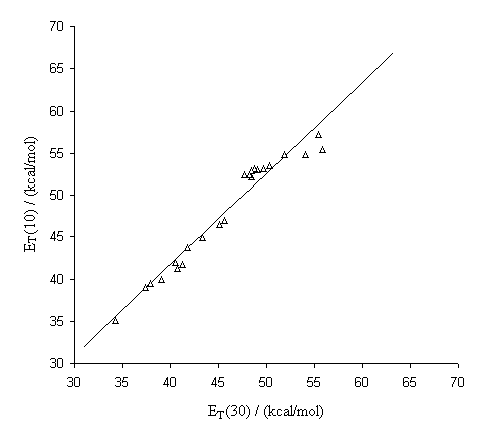
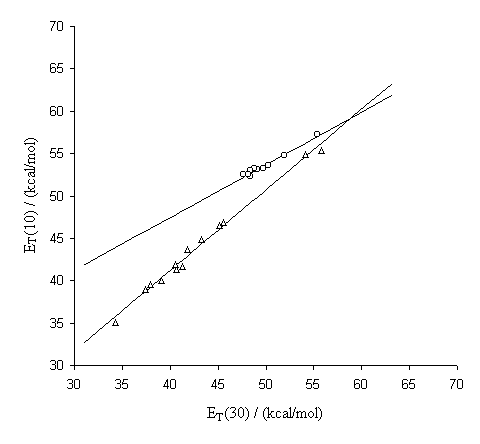
Tabelle 2: |
Längstwellige UV/Vis-Absorptionsmaxima und ET-Werte des Betains 10 sowie die ET(30)-Werte des Betains 1 (* = unter Zugabe von DBU) |
|
|
|
|
|
|
|
|
|
|
|
Lösungsmittel |
ET(30) (kcal/mol) |
l max(11) (nm) |
ET(11) (kcal/mol) |
|
Wasser |
63.1 |
n. meßbar |
- |
|
2,2,2-Trifluorethanol |
59.8 |
Zersetzung |
- |
|
Formamid |
55.8 |
Zersetzung |
- |
|
Methanol |
55.4 |
n. meßbar |
- |
|
N-Methylformamid |
54.1 |
Zersetzung |
- |
|
Ethanol |
51.9 |
523 |
54.7 |
|
1-Propanol |
50.3 |
538 |
53.1 |
|
1-Butanol |
49.7 |
543 |
52.7 |
|
1-Pentanol |
49.1 |
546 |
52.4 |
|
1-Hexanol |
48.8 |
546 |
52.4 |
|
1-Heptanol |
48.4 |
546 |
52.4 |
|
2-Propanol |
48.4 |
562 |
50.9 |
|
1-Octanol |
48.2 |
551 |
51.9 |
|
1-Decanol |
47.7 |
554 |
51.6 |
|
Acetonitril |
45.6 |
622 |
46.0 |
|
Dimethylsulfoxid |
45.1 |
632 |
45.2 |
|
N,N-Dimethylformamid |
43.3 |
653 |
43.8 |
|
Aceton |
41.8 |
672 |
42.5 |
|
1,2-Dichlorethan |
41.3 |
Zersetzung |
- |
|
Dichlormethan |
40.7 |
715 |
40.0 |
|
Pyridin |
40.5 |
708 |
40.4 |
|
Chloroform |
39.1 |
733 |
39.0 |
|
Essigsäureethylester |
37.9 |
742 |
38.5 |
|
Tetrahydrofuran |
37.4 |
757 |
37.8 |
|
1,4-Dioxan |
36.0 |
Zersetzung |
- |
|
t-Butyl-methyl-ether |
34.7 |
n. löslich |
- |
|
Benzen |
34.3 |
856 |
33.4 |
|
Tetrachlormethan |
32.4 |
n. löslich |
- |
|
Cyclohexan |
30.9 |
n. löslich |
- |
|
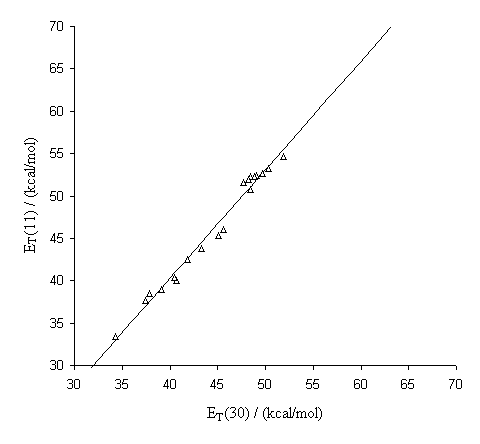
Tabelle 3: |
Längstwellige UV/Vis-Absorptionsmaxima und ET-Werte des Betains 11 sowie die ET(30)-Werte des Betains 1 |
|
|
|
|
|
|
|
|
|
|
|
Lösungsmittel |
ET(30) (kcal/mol) |
l max(12) (nm) |
ET(12) (kcal/mol) |
|
Wasser |
63.1 |
447 |
64.0 |
|
2,2,2-Trifluorethanol |
59.8 |
451 |
63.4 |
|
Formamid |
55.8 |
497 |
57.5 |
|
Methanol |
55.4 |
482 |
59.3 |
|
N-Methylformamid |
54.1 |
506 |
56.5 |
|
Ethanol |
51.9 |
505 |
56.6 |
|
1-Propanol |
50.3 |
516 |
55.4 |
|
1-Butanol |
49.7 |
523 |
54.7 |
|
1-Pentanol |
49.1 |
526 |
54.4 |
|
1-Hexanol |
48.8 |
532 |
53.7 |
|
1-Heptanol |
48.4 |
535 |
53.4 |
|
2-Propanol |
48.4 |
534 |
53.5 |
|
1-Octanol |
48.2 |
538 |
53.1 |
|
1-Decanol |
47.7 |
539 |
53.0 |
|
Acetonitril |
45.6 |
590 |
48.5 |
|
Dimethylsulfoxid |
45.1 |
594 |
48.1 |
|
N,N-Dimethylformamid |
43.3 |
614 |
46.6 |
|
Aceton |
41.8 |
634 |
45.1 |
|
1,2-Dichlorethan |
41.3 |
650 |
44.0 |
|
Dichlormethan |
40.7 |
657 |
43.5 |
|
Pyridin |
40.5 |
657 |
43.5 |
|
Chloroform |
39.1 |
671 |
42.6 |
|
Essigsäureethylester |
37.9 |
695 |
41.1 |
|
Tetrahydrofuran |
37.4 |
705 |
40.6 |
|
1,4-Dioxan |
36.0 |
735 |
38.9 |
|
t-Butyl-methyl-ether |
34.7 |
762 |
37.5 |
|
Benzen |
34.3 |
769 |
37.2 |
|
Tetrachlormethan |
32.4 |
n. löslich |
- |
|
Cyclohexan |
30.9 |
n. löslich |
- |
|
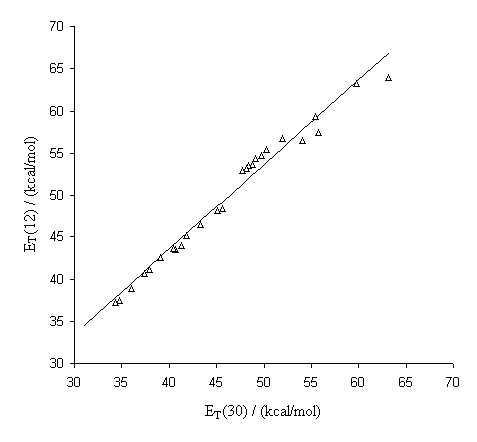
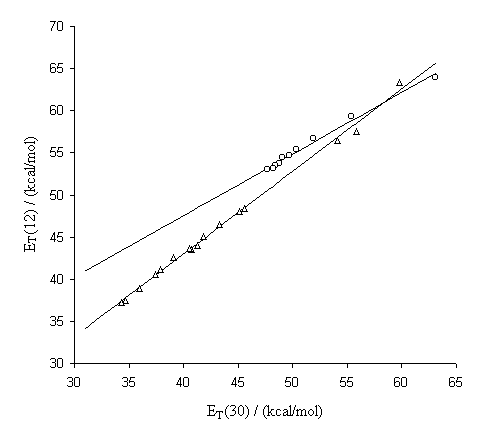
Tabelle 4: |
Längstwellige UV/Vis-Absorptionsmaxima und ET-Werte des Betains 12 sowie die ET(30)-Werte des Betains 1 |
|
|
|
|
|
|
|
|
|
|
|
Lösungsmittel |
ET(30) (kcal/mol) |
l max(13) (nm) |
ET(13) (kcal/mol) |
|
Wasser |
63.1 |
460 |
62.2 |
|
2,2,2-Trifluorethanol |
59.8 |
475 |
60.2 |
|
Formamid |
55.8 |
511 |
56.0 |
|
Methanol |
55.4 |
495 |
57.8 |
|
N-Methylformamid |
54.1 |
516 |
55.4 |
|
Ethanol |
51.9 |
516 |
55.4 |
|
1-Propanol |
50.3 |
530 |
53.9 |
|
1-Butanol |
49.7 |
538 |
53.1 |
|
1-Pentanol |
49.1 |
541 |
52.8 |
|
1-Hexanol |
48.8 |
546 |
52.4 |
|
1-Heptanol |
48.4 |
548 |
52.2 |
|
2-Propanol |
48.4 |
551 |
51.9 |
|
1-Octanol |
48.2 |
551 |
51.9 |
|
1-Decanol |
47.7 |
552 |
51.8 |
|
Acetonitril |
45.6 |
605 |
47.3 |
|
Dimethylsulfoxid |
45.1 |
603 |
47.4 |
|
N,N-Dimethylformamid |
43.3 |
624 |
45.8 |
|
Aceton |
41.8 |
646 |
44.3 |
|
1,2-Dichlorethan |
41.3 |
684 |
41.8 |
|
Dichlormethan |
40.7 |
691 |
41.4 |
|
Pyridin |
40.5 |
676 |
42.3 |
|
Chloroform |
39.1 |
711 |
40.2 |
|
Essigsäureethylester |
37.9 |
709 |
40.3 |
|
Tetrahydrofuran |
37.4 |
723 |
39.5 |
|
1,4-Dioxan |
36.0 |
761 |
37.6 |
|
t-Butyl-methyl-ether |
34.7 |
n. löslich |
- |
|
Benzen |
34.3 |
795 |
36.0 |
|
Tetrachlormethan |
32.4 |
n. löslich |
- |
|
Cyclohexan |
30.9 |
n. löslich |
- |
|
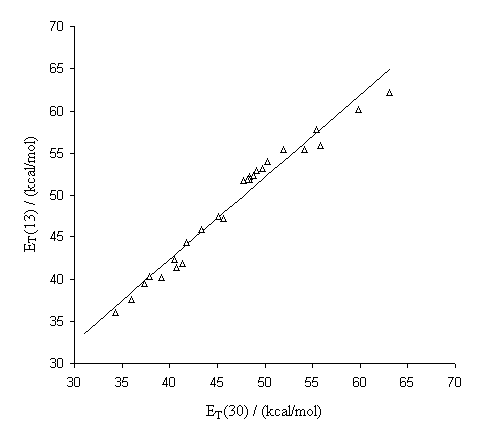
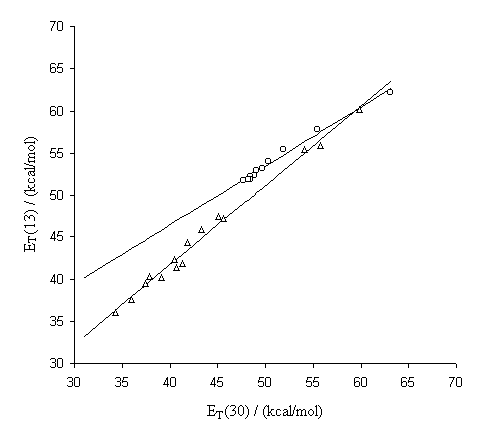
Tabelle 5: |
Längstwellige UV/Vis-Absorptionsmaxima und ET-Werte des Betains 13 sowie die ET(30)-Werte des Betains 1 |
|
|
|
|
|
|
|
|
